
I’m a experimental nuclear physicist turned data scientist. I have a history of using computer simulations for product and experimental optimizations and integrating models into end to end solutions. I’m currently working at Baker McKenzie, exploring how to harness generative AI tools for legal applications.
Posts
|
Testing MLOps with DVC |
At work my team has been experiencing the pain of ad-hoc analysis in Jupyter Hub on tight deadlines. You know the situation - Untitled-4.ipynb and Project_v3_Alice_20240325.ipynb in the same folder with similar modified dates and goodness knows which is the file you’re looking for. I’m investigating tools we might consider introducing to the team workflows to potentially limit how frequently this type of situation crops up. Enter Data Version Control (DVC) - software to organize data and experiments for machine learning projects.
|
|
Exploring Project Structure and Testing |
I created a repository to explore and document continuous development practices. Most notably, I want to explore how automated testing using GitHub Actions (or similar) might be useful in my future data science projects. I’ll be automating tests in pytest, flake8, and mypy with tox, and also connecting to a protected database while ensuring private information is not published.
|
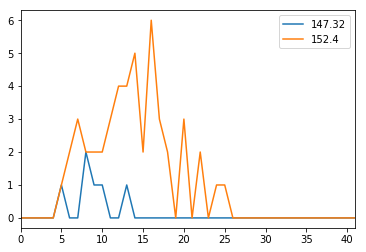
Bilboard top music chart analysis |
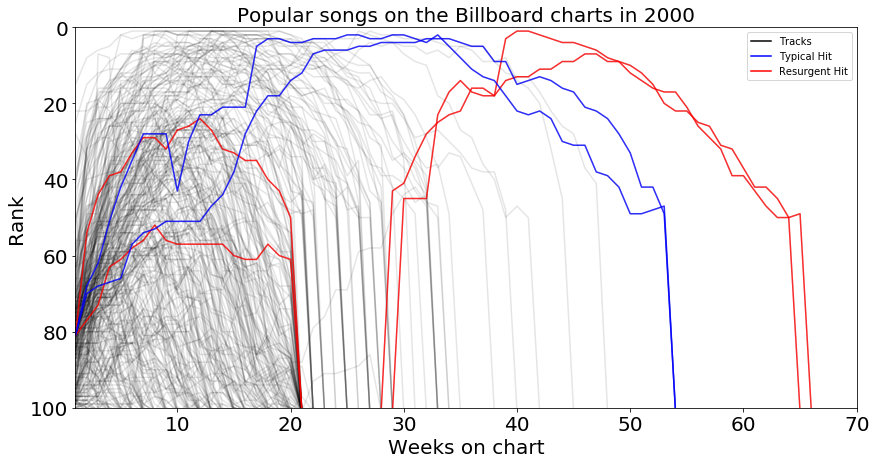
Recently, I took a look at the Billboard top 100 most popular songs from the year 2000. The bulk of this dataset was a series of columns containing each song’s rank in the charts each week after it entered. In the process of cleaning this up and condensing the data into a single column, I came across some interesting trajectory templates: “fads,” “smash hits,” and “resurgent hits.”
|
Titanic survival predictions |
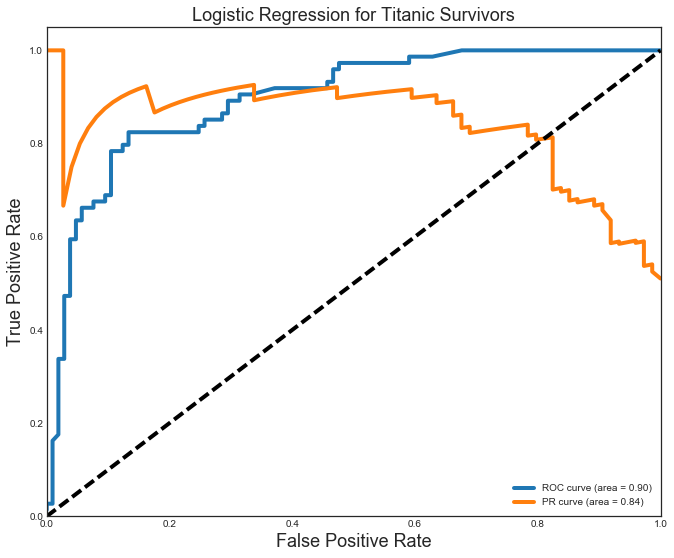
I’ve put together a small analysis to demonstrate how we can create, tune, and evaluate models. I looked at the dataset of Titanic passengers and attempted to predict their survival outcomes based on information from the passenger list. I used a Logistic Regression, kNN, Decision Tree, and Random Forest model. The hyperparameters for each were tuned across a grid space that allowed for full computation in less than 5 minutes.

|
Grid searching data pipelines for wine quality |
I collected a small set of crowd sourced wine data from the web to show how pipelines and grid search can be used together to run data analysis while being careful not to leak information from the test set into the training data.
|
US Salary Summary |
Indeed has published Data Scientist salary information on their site. The publish data averaged over the entire country, for many (~35) individual states, and for several cities in each of those states. I am looping over each page in their location list to collect information on the salary average and range and an indication of the size of the market in each location.
|
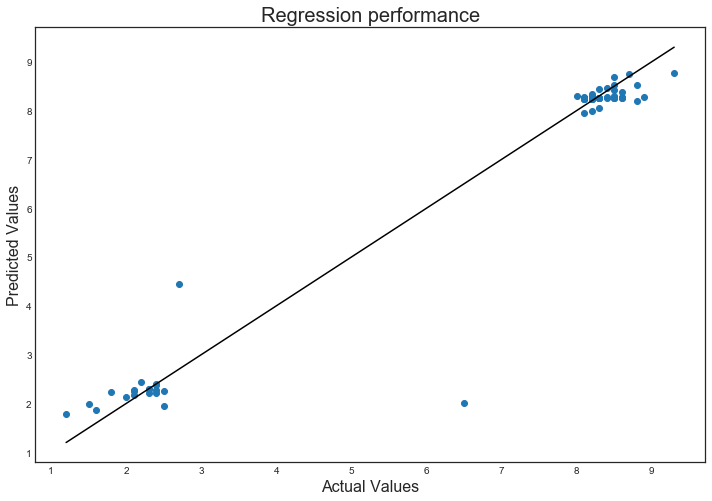
Predicting successful movies on IMDB |
To help better assess which movies to bring into the Netflix streaming catalog, I have pulled data for the best and worst movies in the IMDB database and created two models from that data to predict ratings for other movies. A total of 350 records were downloaded: the top 250, and the bottom 100.
|
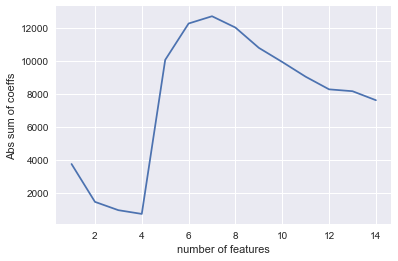
Housing market analysis |
We have a data set of real estate prices from Aimes, Iowa. Our goal is to provide a model to predict prices using a subset of the columns to be able to reduce the size of the database the company is required to store. We are also interested in providing descriptive statistics for the market, specifically which neighborhoods have many sales and high prices. Finally, we are interested in describing how this data has changed over time.
| Post Jupyter notebooks to your GitHub blog |
Info to help convert the Jupyter notebooks we use in class into blog posts for your github blog. Manual conversion instructions are given for one-off posts, as well as detials to make a bash alias to automate the conversion process, move the files, and update your blog in one fell swoop.
|
Notebook conversion example |
A quick example of how the conversion tool can convert an Jupyter notebook into markdown files and associated images. I demonstrate how common items like code blocks and inline images work well, while other features (namely Latex equations) do not.
|
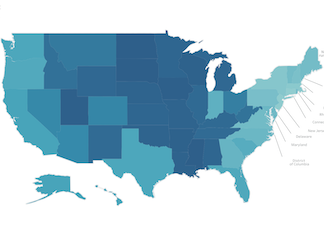
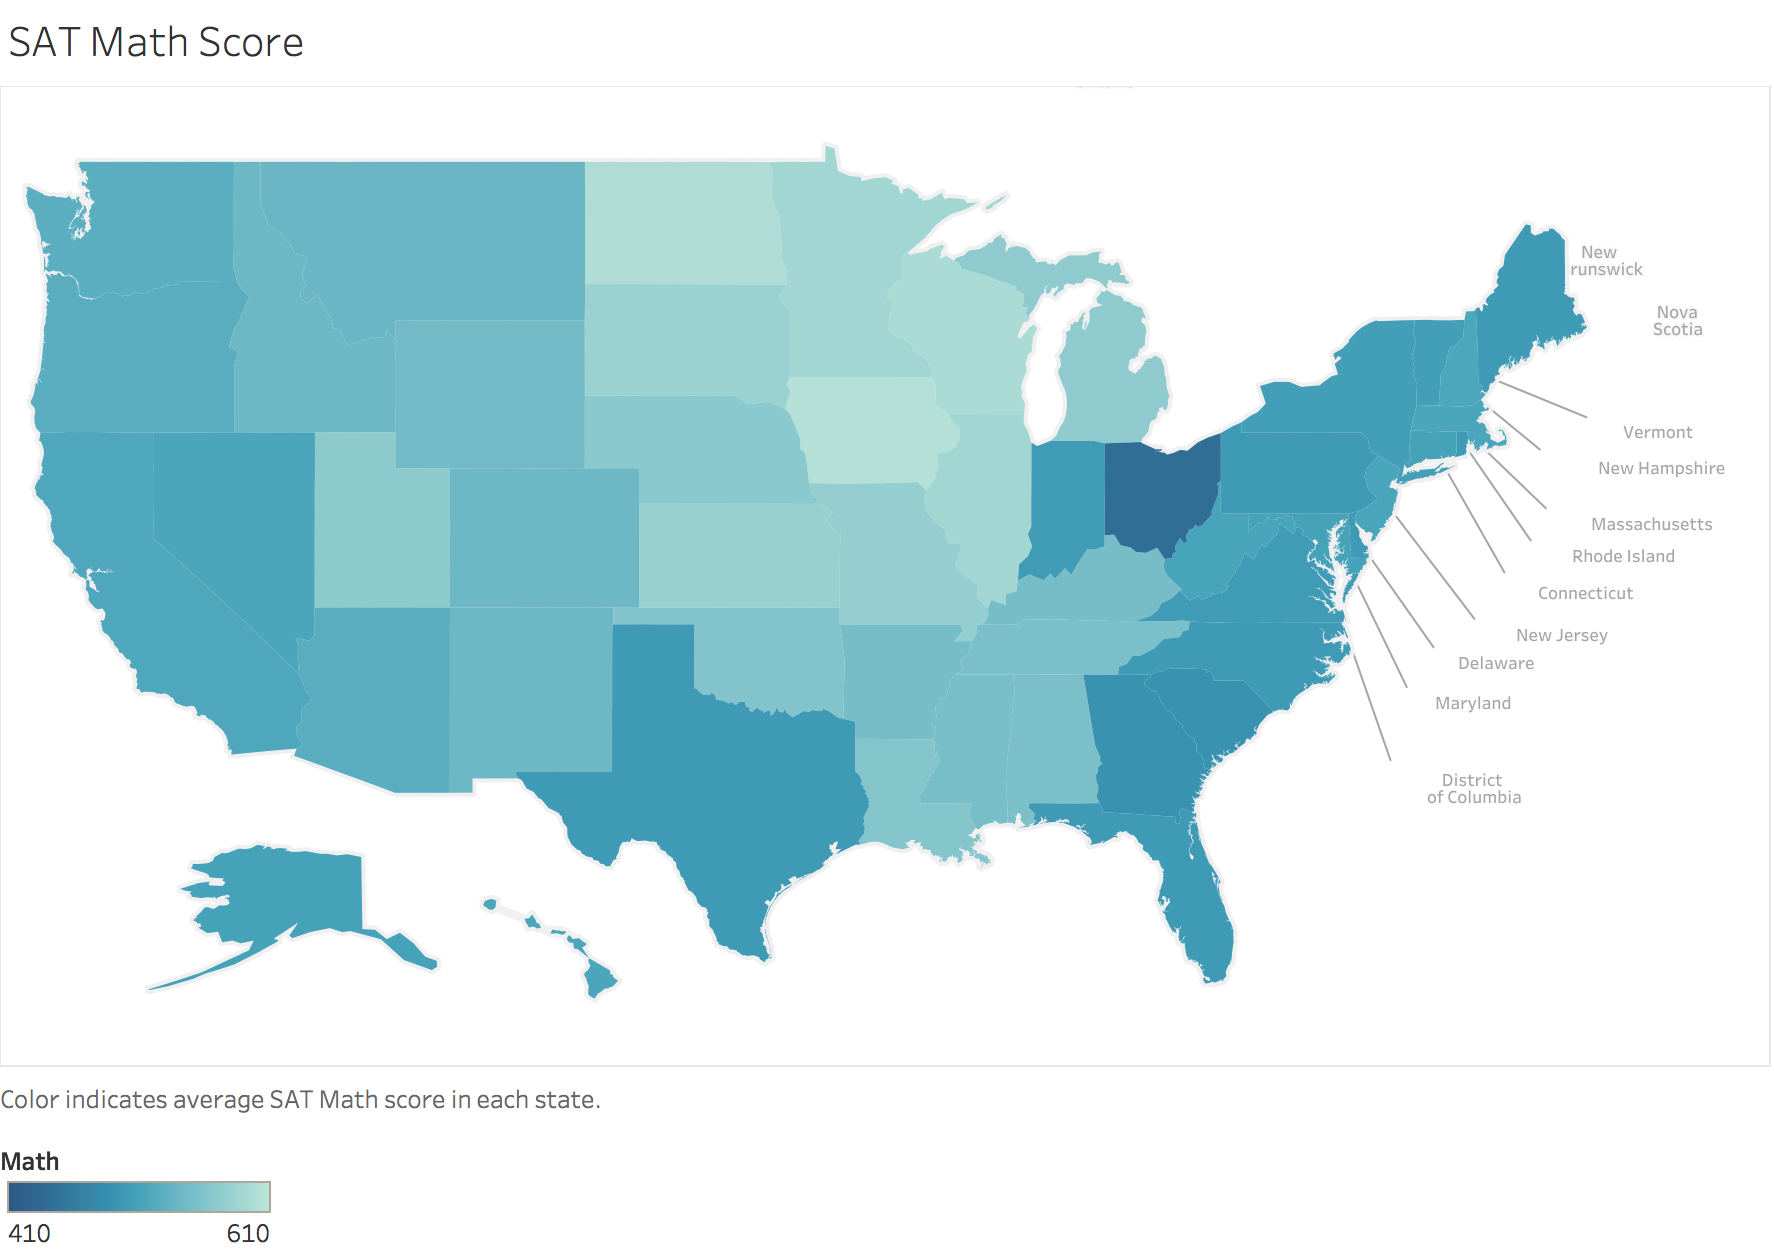
Exploring US SAT scores |
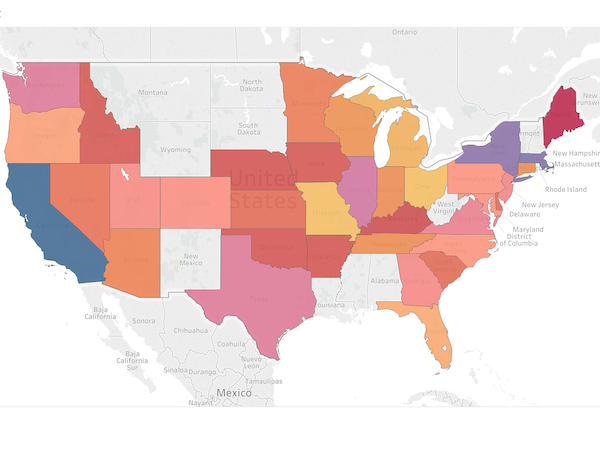
I took a look at SAT score summaries by US state. I found that there is a lot of variation in the proportion of students in each state who take the SAT test, and also correlations between that rate and the testing scores. Finally, I made some choropleths to visualize the spatial distribution of scores across the country.
|
Custom choropleths in Tableau |
We worked with some data about SAT scores and test taking rates in every state over the last week. I was able to use Tableau with some custom mapping options to keep the image looking professional.
|
Open Github repo from terminal |
I was chatting with Andrew this morning, and he had the great idea that it would be awesome to open our GitHub repo pages from the CLI. We hashed out a rough draft this morning, but I’ve cleaned it up and bit and thought I would share here.

|
I’ve set up a new blog! |
I’m planning to use this space to showcase some of the projects and events I participate as a Data Scientist.