
Grid searching data pipelines for wine quality
I collected a small set of crowd sourced wine data from the web to show how pipelines and grid search can be used together to run data analysis while being careful not to leak information from the test set into the training data.
##Load the data
data = response.json()  ## The data is in JSON format
df = pd.DataFrame(data)
df.head(10)
| Color | Consumed In | Country | Grape | Name | Price | Region | Score | Vintage | Vinyard | |
|---|---|---|---|---|---|---|---|---|---|---|
| 0 | W | 2015 | Portugal | Portugal | 4 | 2013 | Vinho Verde | |||
| 1 | W | 2015 | France | 17.8 | France | 3 | 2013 | Peyruchet | ||
| 2 | W | 2015 | Oregon | 20 | Oregon | 3 | 2013 | Abacela | ||
| 3 | W | 2015 | Spain | chardonay | 7 | Spain | 2.5 | 2012 | Ochoa | |
| 4 | R | 2015 | US | chiraz, cab | Spice Trader | 6 | 3 | 2012 | Heartland | |
| 5 | R | 2015 | US | cab | 13 | California | 3.5 | 2012 | Crow Canyon | |
| 6 | R | 2015 | US | #14 | 21 | Oregon | 2.5 | 2013 | Abacela | |
| 7 | R | 2015 | France | merlot, cab | 12 | Bordeaux | 3.5 | 2012 | David Beaulieu | |
| 8 | R | 2015 | France | merlot, cab | 11.99 | Medoc | 3.5 | 2011 | Chantemerle | |
| 9 | R | 2015 | US | merlot | 13 | Washington | 4 | 2011 | Hyatt |
Split the data
from sklearn.model_selection import train_test_split
X_train, X_test, y_train, y_test, = train_test_split(X, y, test_size=0.2, random_state=42)
Set up classes for custom pipeline
class ModelTransformer(BaseEstimator,TransformerMixin):

    def __init__(self, model=None):
        self.model = model

    def fit(self, *args, **kwargs):
        self.model.fit(*args, **kwargs)
        return self

    def transform(self, X, **transform_params):
        return self.model.transform(X)

class SampleExtractor(BaseEstimator, TransformerMixin):
    """Takes in varaible names as a **list**"""

    def __init__(self, vars):
        self.vars = vars  # e.g. pass in a column names to extract

    def transform(self, X, y=None):
        if len(self.vars) > 1:
            return pd.DataFrame(X[self.vars]) # where the actual feature extraction happens
        else:
            return pd.Series(X[self.vars[0]])

    def fit(self, X, y=None):
        return self  # generally does nothing


class DenseTransformer(BaseEstimator,TransformerMixin):

    def transform(self, X, y=None, **fit_params):
#         print X.todense()
        return X.todense()

    def fit_transform(self, X, y=None, **fit_params):
        self.fit(X, y, **fit_params)
        return self.transform(X)

    def fit(self, X, y=None, **fit_params):
        return self
Run data with KFolds cross validation
kf_shuffle = StratifiedKFold(n_splits=3,shuffle=True,random_state=777)

binary = True
feats = 5

pipeline = Pipeline([
    ('features', FeatureUnion([
        ('Color', Pipeline([
                      ('text',SampleExtractor(['Color'])),
                      ('dummify', CountVectorizer(binary=binary, max_features=feats)),
                      ('densify', DenseTransformer()),
                     ])),
        ('Country', Pipeline([
                      ('text',SampleExtractor(['Country'])),
                      ('dummify', CountVectorizer(binary=binary, max_features=feats)),
                      ('densify', DenseTransformer()),
                     ])),
        ('Grape', Pipeline([
                      ('text',SampleExtractor(['Grape'])),
                      ('dummify', CountVectorizer(binary=binary, max_features=feats)),
                      ('densify', DenseTransformer()),
                     ])),
        ('Name', Pipeline([
                      ('text',SampleExtractor(['Name'])),
                      ('dummify', CountVectorizer(binary=binary, max_features=feats)),
                      ('densify', DenseTransformer()),
                     ])),
        ('Region', Pipeline([
                      ('text',SampleExtractor(['Region'])),
                      ('dummify', CountVectorizer(binary=binary, max_features=feats)),
                      ('densify', DenseTransformer()),
                     ])),
        ('Vinyard', Pipeline([
                      ('text',SampleExtractor(['Vinyard'])),
                      ('dummify', CountVectorizer(binary=binary, max_features=feats)),
                      ('densify', DenseTransformer()),
                     ])),
        ('cont_features', Pipeline([
                      ('continuous', SampleExtractor(['Consumed In', 'Price', 'Vintage'])),
                      ('impute',Imputer()),
                      ])),
        ])),
        ('scale', ModelTransformer()),
        ('tree', tree.DecisionTreeRegressor()),
])


parameters = {
    'features__Color__dummify__analyzer':['char'],
    'scale__model': (StandardScaler(),MinMaxScaler()),
    'tree__max_depth': (2,3,4,None),
    'tree__min_samples_split': (2,3,4,5),
}

grid_search = GridSearchCV(pipeline, parameters, verbose=False, cv=kf_shuffle)
Execute the pipeline
print("Performing grid search...")
print("pipeline:", [name for name, _ in pipeline.steps])
print("parameters:")
print(parameters)


grid_search.fit(X_train, y_train)

print("Best score: %0.3f" % grid_search.best_score_)
print("Best parameters set:")
best_parameters = grid_search.best_estimator_.get_params()
for param_name in sorted(parameters.keys()):
    print("\t%s: %r" % (param_name, best_parameters[param_name]))


cv_pred = pd.Series(grid_search.predict(X_test))
Performing grid search...
('pipeline:', ['features', 'scale', 'tree'])
parameters:
{'tree__min_samples_split': (2, 3, 4, 5), 'tree__max_depth': (2, 3, 4, None), 'scale__model': (StandardScaler(copy=True, with_mean=True, with_std=True), MinMaxScaler(copy=True, feature_range=(0, 1))), 'features__Color__dummify__analyzer': ['char']}
Best score: 0.964
Best parameters set:
	features__Color__dummify__analyzer: 'char'
	scale__model: StandardScaler(copy=True, with_mean=True, with_std=True)
	tree__max_depth: 2
	tree__min_samples_split: 3
Take a peek at the results
pd.DataFrame(zip(grid_search.cv_results_['mean_test_score'],\
                 grid_search.cv_results_['std_test_score']\
                )).sort_values(0,ascending=False).head(10)
| 0 | 1 | |
|---|---|---|
| 17 | 0.963752 | 0.009070 |
| 1 | 0.963752 | 0.009070 |
| 20 | 0.958414 | 0.010273 |
| 13 | 0.955670 | 0.017514 |
| 15 | 0.955079 | 0.007642 |
| 27 | 0.955020 | 0.010817 |
| 6 | 0.954595 | 0.010570 |
| 26 | 0.952498 | 0.011002 |
| 9 | 0.838367 | 0.134405 |
| 22 | 0.835760 | 0.139155 |
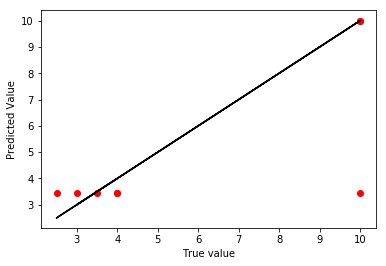
grid_search.score(X_test,y_test) # prints the R2 for the best predictor
0.46448936196721591
plt.scatter(y_test,cv_pred,color='r')
plt.plot(y_test,y_test,color='k')
plt.xlabel("True value")
plt.ylabel("Predicted Value")
plt.show()
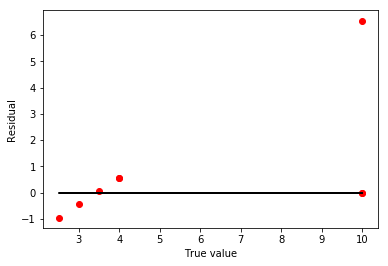
plt.scatter(y_test,y_test.values-cv_pred.values,color='r')
plt.plot(y_test,y_test-y_test,color='k')
plt.xlabel("True value")
plt.ylabel("Residual")
plt.show()
Results Summary
I was able to run a grid search on the data, and found that two models fit the training data equally well. When applied as a predictor on the test set, I get an R-squared value of 46.4%. Looking at the plots, I seem to be over fit and predicting a wild outlier at the right side. There is also a linear pattern to my residuals from one model, but the small sample size makes it hard to predict if that is by chance.
Written on May 10, 2017