
US Salary Summary
Indeed has published Data Scientist salary information on their site. The publish data averaged over the entire country, for many (~35) individual states, and for several cities in each of those states. I am looping over each page in their location list to collect information on the salary average and range and an indication of the size of the market in each location.
import requests
from bs4 import BeautifulSoup
import pandas as pd

URL = "https://www.indeed.com/salaries/Data-Scientist-Salaries"

res = requests.get(URL)
page_source = BeautifulSoup(res.content,"lxml")
Example market size extraction
USA_respondents = int(page_source.find('div', class_="cmp-salary-header-content").text.split()[3].replace(",",""))
# this is the number of salary survey respondents
# which I will use as an indicator of size of industry in the location
print("salary info collected from {:,d} entities in the USA").format(USA_respondents)
salary info collected from 35,741 entities in the USA
Extract lists of URLs for states and cities
state_list = page_source.findAll('option', {'data-tn-element':"loc_state[]"})
state_URLs = [i.attrs['value'] for i in state_list]
state_URLs[:3]
['/salaries/Data-Scientist-Salaries,-Arizona',
 '/salaries/Data-Scientist-Salaries,-Arkansas',
 '/salaries/Data-Scientist-Salaries,-California']
city_list = page_source.findAll('option', {'data-tn-element':"loc_city[]"})
city_URLs = [i.attrs['value'] for i in city_list]
city_URLs[:13]  # to show several states
['/salaries/Data-Scientist-Salaries,-Chandler-AZ',
 '/salaries/Data-Scientist-Salaries,-Peoria-AZ',
 '/salaries/Data-Scientist-Salaries,-Phoenix-AZ',
 '/salaries/Data-Scientist-Salaries,-Scottsdale-AZ',
 '/salaries/Data-Scientist-Salaries,-Bentonville-AR',
 '/salaries/Data-Scientist-Salaries,-Little-Rock-AR',
 '/salaries/Data-Scientist-Salaries,-Aliso-Viejo-CA',
 '/salaries/Data-Scientist-Salaries,-Belmont-CA',
 '/salaries/Data-Scientist-Salaries,-Berkeley-CA',
 '/salaries/Data-Scientist-Salaries,-Beverly-Hills-CA',
 '/salaries/Data-Scientist-Salaries,-Brisbane-CA',
 '/salaries/Data-Scientist-Salaries,-Burlingame-CA',
 '/salaries/Data-Scientist-Salaries,-Campbell-CA']
Example salary info extraction
USA_min_salary = page_source.find('div', class_="cmp-sal-min").text
print("{} is the minimum reported salary in the USA").format(USA_min_salary)
$45,000 is the minimum reported salary in the USA
USA_max_salary = page_source.find('div', class_="cmp-sal-max").text
print("{} is the maximum reported salary in the USA").format(USA_max_salary)
$257,000 is the maximum reported salary in the USA
USA_avg_salary = page_source.find('div', class_="cmp-sal-salary").text.encode('utf-8')
print("{} is the average reported salary in the USA").format(USA_avg_salary)
$129,996 per year is the average reported salary in the USA
Generalize examples into functions for use in loop
def extract_min_salary(location_source):
    a = location_source.find('div', class_="cmp-sal-min")
    return a.text.strip() if a else None

def extract_max_salary(location_source):
    a = location_source.find('div', class_="cmp-sal-max")
    return a.text.strip() if a else None

def extract_avg_salary(location_source):
    a = location_source.find('div', class_="cmp-sal-salary")
    return a.text.strip() if a else None

def extract_respondents(location_source):
    a = location_source.find('div', class_="cmp-salary-header-content")
    return a.text.split()[3] if a else None
Loop over states
state_results = []
for loc in state_URLs:
    state_res = requests.get("https://www.indeed.com"+loc)
    state_source = BeautifulSoup(state_res.content,"lxml")
    state_results.append(
                        (" ".join(loc.split("-")[3:]), \
                        extract_respondents(state_source), \
                        extract_min_salary(state_source), \
                        extract_max_salary(state_source), \
                        extract_avg_salary(state_source))
                        )
state_results
[('Arizona', u'78', u'$37,000', u'$293,000', u'$134,893\xa0per year'),
 ('Arkansas', u'19', u'$42,000', u'$211,000', u'$110,310\xa0per year'),
 ('California', u'13,556', u'$53,000', u'$271,000', u'$141,132\xa0per year'),
 ('Colorado', u'473', u'$44,000', u'$199,000', u'$107,772\xa0per year'),
 ('Connecticut', u'105', u'$41,000', u'$214,000', u'$110,914\xa0per year'),
 ... abbreviated ...
 ('Washington State',
  u'1,216',
  u'$51,000',
  u'$244,000',
  u'$130,428\xa0per year'),
 ('Wisconsin', u'119', u'$40,000', u'$266,000', u'$128,591\xa0per year')]
city_results = []
for loc in city_URLs:
    city_res = requests.get("https://www.indeed.com"+loc)
    city_source = BeautifulSoup(city_res.content,"lxml")
    city_results.append(
                        (" ".join(loc.split("-")[3:-1]),loc.split("-")[-1], \
                        extract_respondents(city_source), \
                        extract_min_salary(city_source), \
                        extract_max_salary(city_source), \
                        extract_avg_salary(city_source))
                        )
city_results
[('Chandler', 'AZ', u'6', u'$58,000', u'$189,000', u'$115,171\xa0per year'),
 ('Peoria', 'AZ', u'7', u'$26.25', u'$78.75', u'$52.44\xa0per hour'),
 ('Phoenix', 'AZ', u'45', u'$45,000', u'$329,000', u'$154,611\xa0per year'),
 ('Scottsdale', 'AZ', u'20', u'$44,000', u'$223,000', u'$116,825\xa0per year'),
 ('Bentonville', 'AR', u'10', u'$44,000', u'$167,000', u'$95,697\xa0per year'),
 ('Little Rock', 'AR', u'6', u'$56,000', u'$224,000', u'$126,671\xa0per year'),
 ('Aliso Viejo', 'CA', u'8', u'$59,000', u'$178,000', u'$117,018\xa0per year'),
 ('Belmont', 'CA', u'12', u'$43,000', u'$334,000', u'$154,806\xa0per year'),
 ('Berkeley', 'CA', u'520', u'$46,000', u'$300,000', u'$146,102\xa0per year'),
 ('Beverly Hills',
  'CA',
  u'25',
  u'$56,000',
  u'$226,000',
  u'$127,280\xa0per year'),
 ('Brisbane', 'CA', u'38', u'$31,000', u'$214,000', u'$102,626\xa0per year'),
 ('Burlingame', 'CA', u'9', u'$61,000', u'$197,000', u'$121,329\xa0per year'),
 ('Campbell', 'CA', u'18', u'$38,000', u'$315,000', u'$143,933\xa0per year'),
 ('Carlsbad', 'CA', u'149', u'$47,000', u'$215,000', u'$116,523\xa0per year'),
 ... abbreviated ...
 ('Vancouver', 'WA', u'6', u'$65,000', u'$196,000', u'$128,488\xa0per year'),
 ('Kohler', 'WI', u'5', u'$70,000', u'$210,000', u'$140,000\xa0per year'),
 ('Madison', 'WI', u'76', u'$41,000', u'$268,000', u'$130,306\xa0per year'),
 ('Milwaukee', 'WI', u'34', u'$37,000', u'$271,000', u'$127,714\xa0per year')]
Convert results to DataFrames
state_df = pd.DataFrame(state_results, columns=('state','number_resps',"min_salary","max_salary",'avg_salary'))
city_df = pd.DataFrame(city_results, columns=('city','State','number_resps',"min_salary","max_salary",'avg_salary'))
print state_df.head(2)
print
print city_df.head(2)
      state number_resps min_salary max_salary         avg_salary
0   Arizona           78    $37,000   $293,000  $134,893 per year
1  Arkansas           19    $42,000   $211,000  $110,310 per year

       city State number_resps min_salary max_salary         avg_salary
0  Chandler    AZ            6    $58,000   $189,000  $115,171 per year
1    Peoria    AZ            7     $26.25     $78.75    $52.44 per hour
city_df.head(5)
| city | State | number_resps | min_salary | max_salary | avg_salary | |
|---|---|---|---|---|---|---|
| 0 | Chandler | AZ | 6 | $58,000 | $189,000 | $115,171 per year |
| 1 | Peoria | AZ | 7 | $26.25 | $78.75 | $52.44 per hour |
| 2 | Phoenix | AZ | 45 | $45,000 | $329,000 | $154,611 per year |
| 3 | Scottsdale | AZ | 20 | $44,000 | $223,000 | $116,825 per year |
| 4 | Bentonville | AR | 10 | $44,000 | $167,000 | $95,697 per year |
Function to fix salaries
def fix_salaries(salary_string):
    """
    takes salary string from indeed listing
    and converts it to annual equivalient.
    """
    salary = 0
    salary_list = salary_string.replace("$","").replace(",","").strip().split()
    if "-" in salary_list[0]:
        temp = salary_list[0].split("-")
        salary = sum([float(a) for a in temp])/len(temp)
    else:
        salary = float(salary_list[0])
    if salary_list[-1] == "month":
        salary *= 12
    elif salary_list[-1] == "hour":
        salary *= 2000
    return salary
city_df['avg_salary'] = city_df['avg_salary'].map(fix_salaries)
state_df['avg_salary'] = state_df['avg_salary'].map(fix_salaries)
Silicone Valley and NYC have the highest salaries on average
cities_money = city_df.sort_values(by='avg_salary',ascending=False).head(50)
cities_money.head(10)
| city | State | number_resps | min_salary | max_salary | avg_salary | |
|---|---|---|---|---|---|---|
| 168 | South Plainfield | NJ | 81 | $93,000 | $347,000 | 200233.0 |
| 28 | Los Gatos | CA | 105 | $78,000 | $359,000 | 193215.0 |
| 192 | Roland | OK | 5 | $95,000 | $289,000 | 187624.0 |
| 174 | Manhattan | NY | 169 | $76,000 | $309,000 | 173056.0 |
| 167 | South Hackensack | NJ | 6 | $67,000 | $322,000 | 171467.0 |
| 29 | Marina del Rey | CA | 119 | $85,000 | $268,000 | 167764.0 |
| 53 | South San Francisco | CA | 15 | $57,000 | $328,000 | 165416.0 |
| 176 | Philadelphia | NY | 20 | $80,000 | $243,000 | 160839.0 |
| 58 | West Hollywood | CA | 49 | $44,000 | $343,000 | 158234.0 |
| 43 | San Francisco Bay Area | CA | 30 | $73,000 | $272,000 | 156986.0 |
Fix the number of respondents
city_df['number_resps'] = city_df['number_resps'].map(lambda x: x.replace(",","")).map(int)
state_df['number_resps'] = state_df['number_resps'].map(lambda x: x.replace(",","")).map(int)
SF, SV, NYC, Boston, and Chicago are all major markets
cities_jobs = city_df.sort_values(by='number_resps',ascending=False).head(50)
cities_jobs.head(10)
| city | State | number_resps | min_salary | max_salary | avg_salary | |
|---|---|---|---|---|---|---|
| 42 | San Francisco | CA | 4488 | $50,000 | $274,000 | 140286.0 |
| 175 | New York | NY | 4306 | $45,000 | $284,000 | 139598.0 |
| 126 | Cambridge | MA | 2093 | $62,000 | $228,000 | 132209.0 |
| 124 | Boston | MA | 1955 | $53,000 | $211,000 | 119223.0 |
| 92 | Chicago | IL | 1349 | $54,000 | $229,000 | 126485.0 |
| 36 | Palo Alto | CA | 1127 | $61,000 | $264,000 | 145239.0 |
| 44 | San Jose | CA | 819 | $65,000 | $256,000 | 144811.0 |
| 38 | Redwood City | CA | 722 | $67,000 | $279,000 | 155545.0 |
| 71 | Washington | DC | 721 | $38,000 | $244,000 | 119036.0 |
| 131 | Marlborough | MA | 721 | $65,000 | $198,000 | 129984.0 |
Make list of the top cities to search
Copy these results over to next file in analysis path.
cities_to_search = pd.concat([cities_jobs,cities_money])
cities_to_search.drop_duplicates(inplace=True)
[x[0].replace(" ","+") + "%2C+" + x[1] for x in list(cities_to_search[['city','State']].values)]
['San+Francisco%2C+CA',
 'New+York%2C+NY',
 'Cambridge%2C+MA',
 'Boston%2C+MA',
 'Chicago%2C+IL',
 'Palo+Alto%2C+CA',
 'San+Jose%2C+CA',
 'Redwood+City%2C+CA',
 .... abbreviated ....
 'Renton%2C+WA',
 'Portland%2C+OR',
 'San+Francisco%2C+CA',
 'St+Petersburg+Beach%2C+FL',
 'Kohler%2C+WI',
 'Foster+City%2C+CA',
 'New+York%2C+NY',
 'Union%2C+NJ']
Write results to file for other analysis
state_df.to_csv("states.csv")
city_df.to_csv("cities.csv")
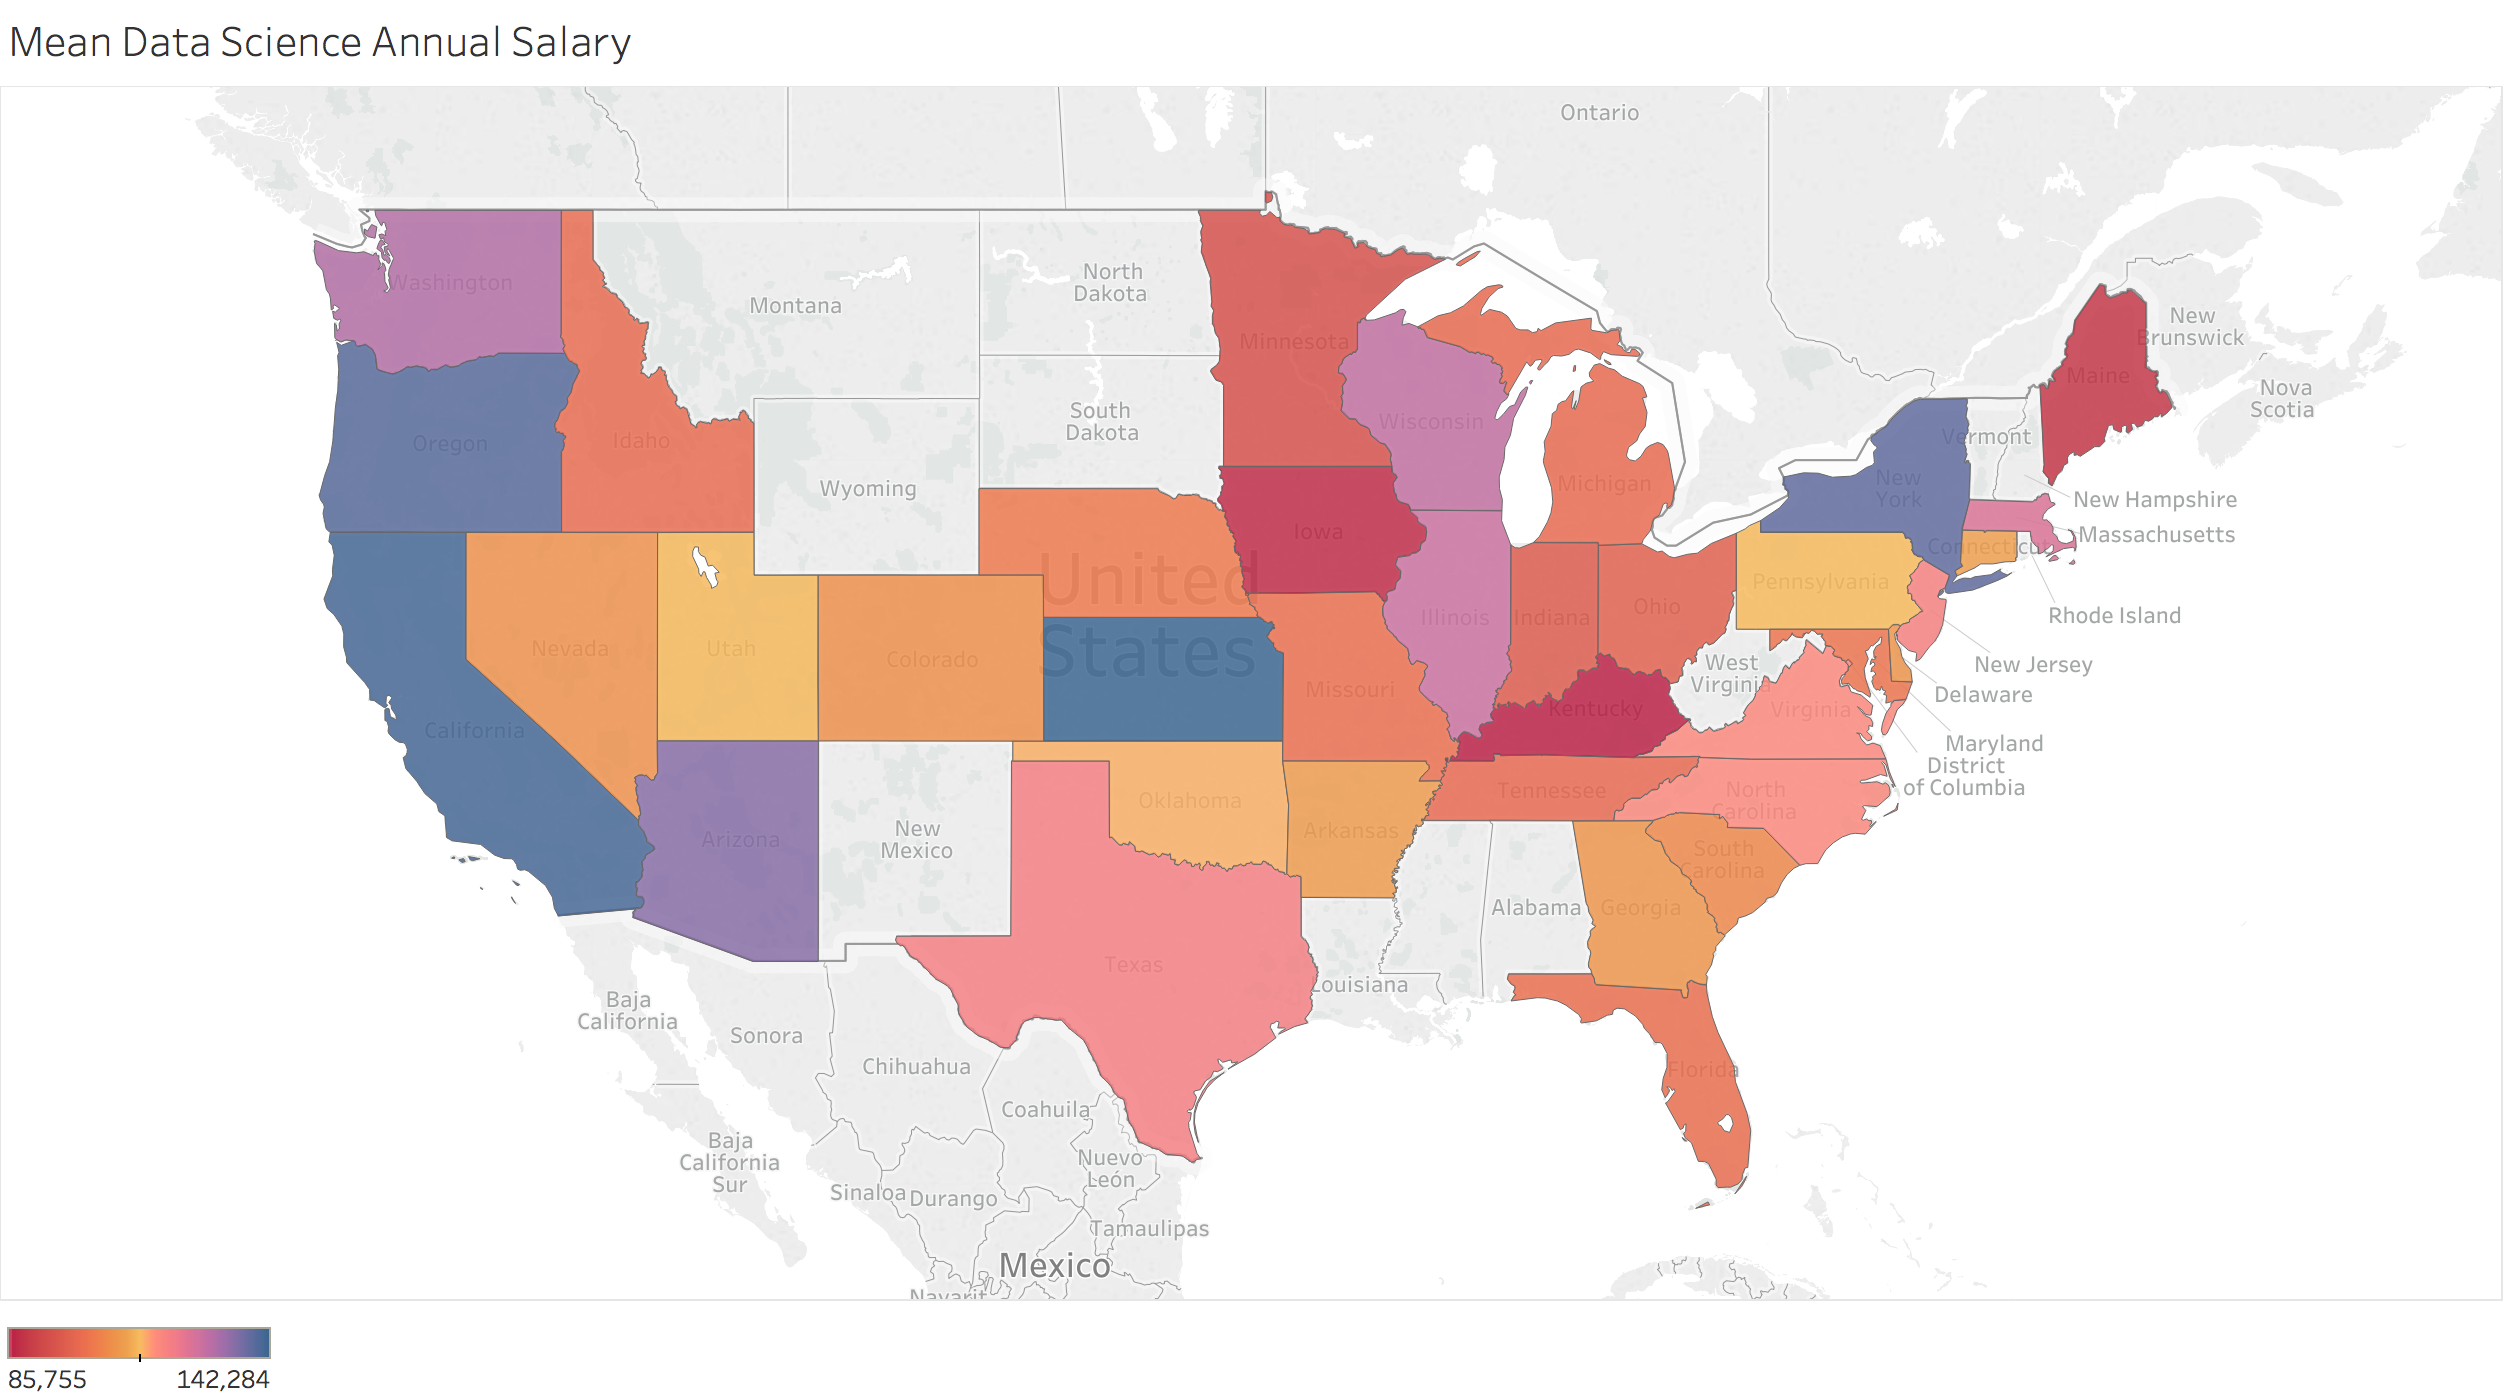
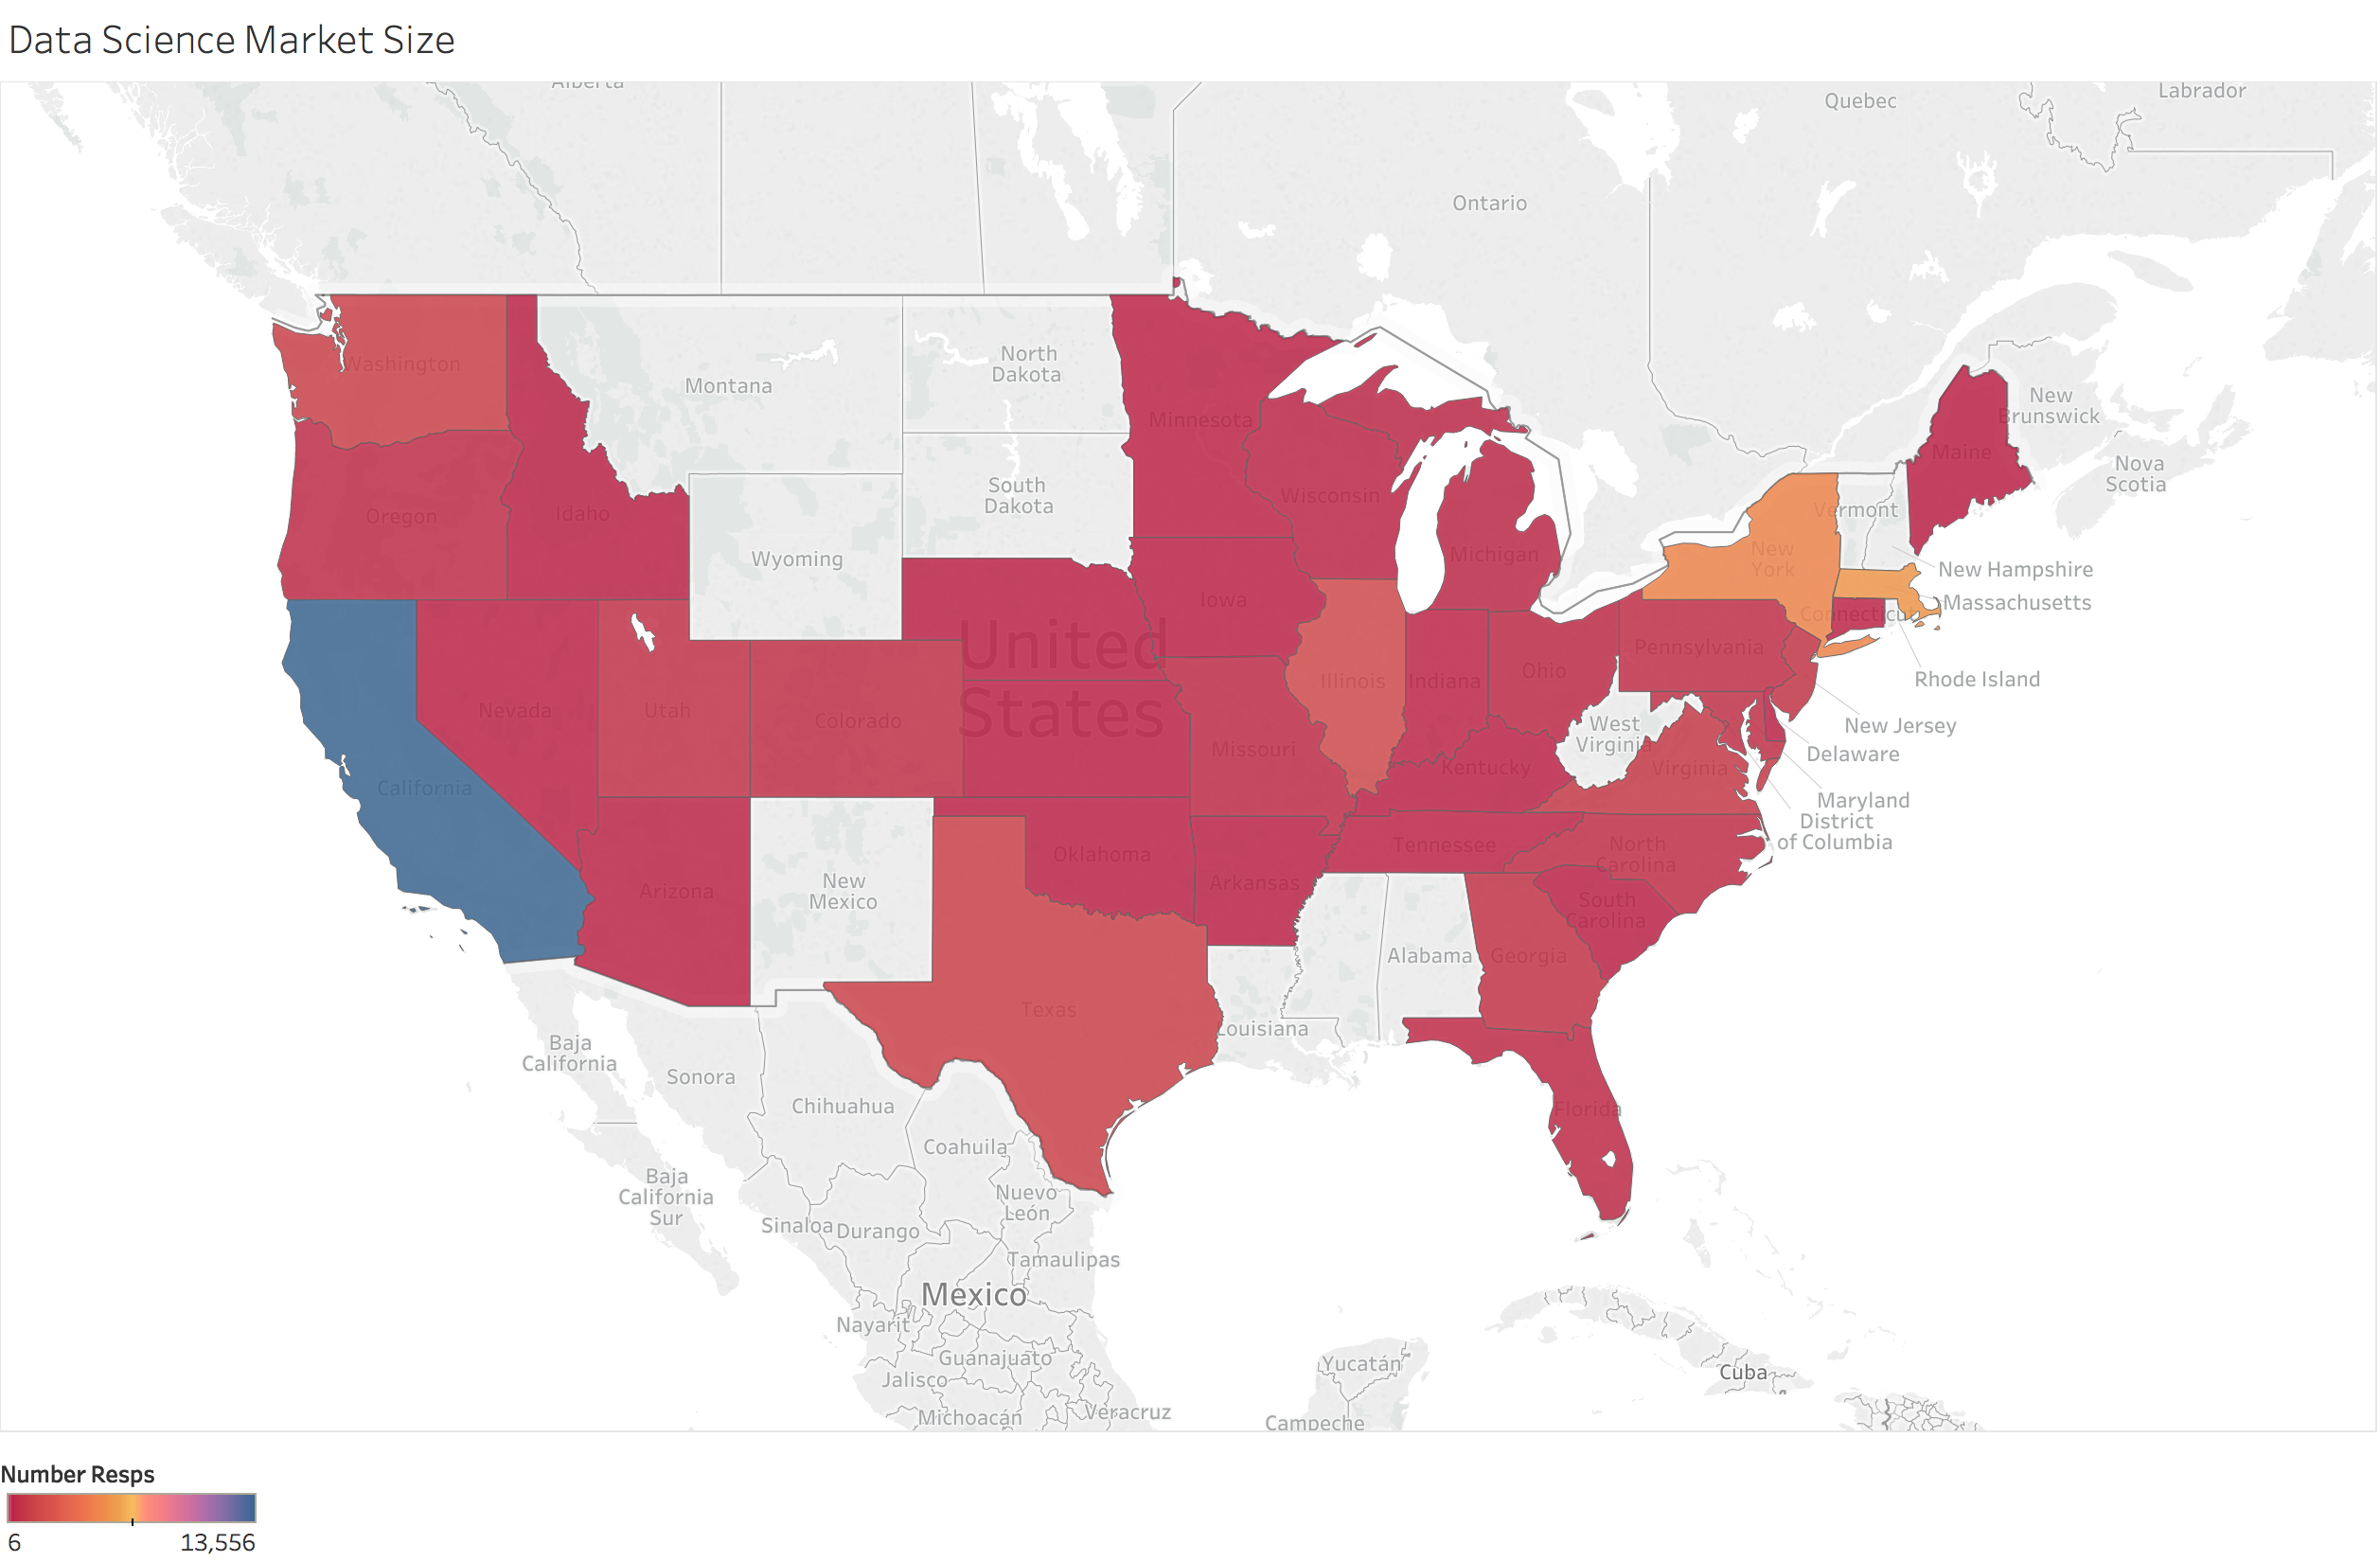
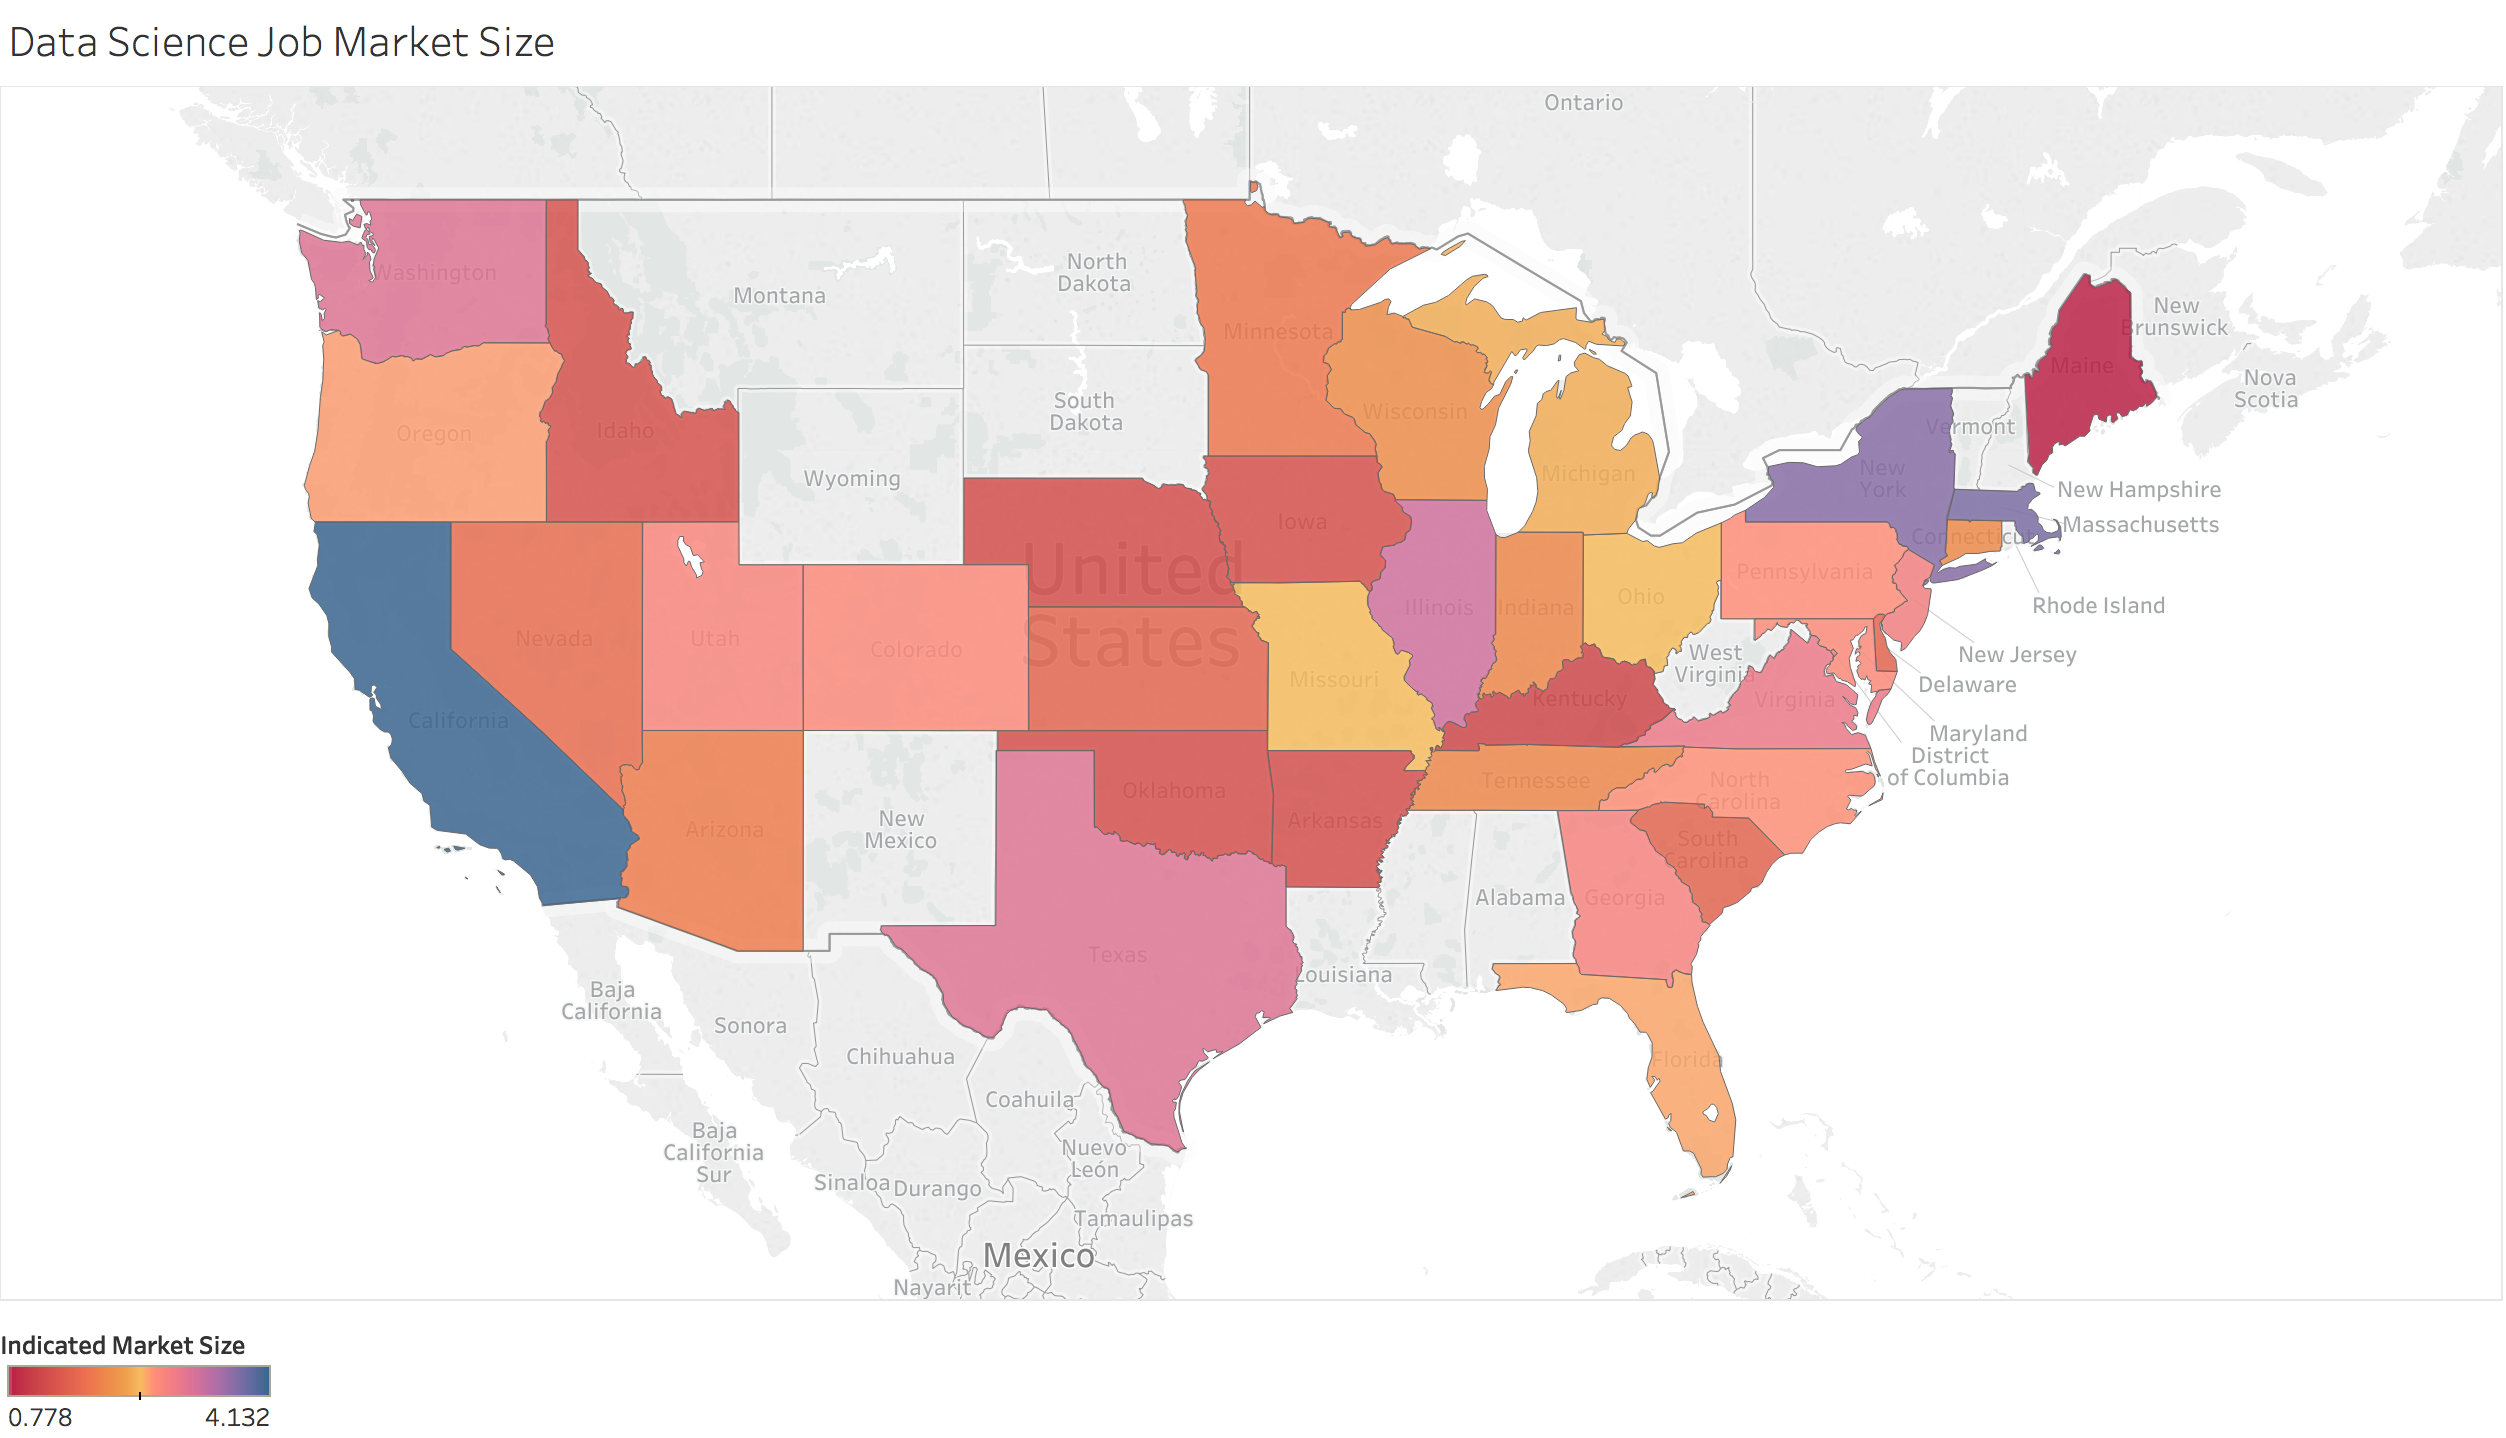
Mapping of the data
I also used these files to create some maps to visualize the data.
Written on April 23, 2017