
Testing MLOps with DVC
At work my team has been experiencing the pain of ad-hoc analysis in Jupyter Hub on tight deadlines. You know the situation - Untitled-4.ipynb and Project_v3_Alice_20240325.ipynb in the same folder with similar modified dates and goodness knows which is the file you’re looking for. I’m investigating tools we might consider introducing to the team workflows to potentially limit how frequently this type of situation crops up. Enter Data Version Control (DVC) - software to organize data and experiments for machine learning projects.
I am kicking the tires to test how DVC tracks data (inputs, generated features, and output files), model versioning with parameter values, and finally to make streamlined and understandable workflows to facilitate collaboration and revisiting the project later. Hopefully this can help my team keep a catalog of previous work with any version ready to run immediately and also to assess and share results from different models.
Example project
As a workspace to run these tests, I found a Kaggle project for learning Time Series to work through using DVC. The training data for the project consists of synthetically generated daily product sales figures for fake retailers in various countries. The task is to predict daily sales for those products for an entire year in each retail location. Feature generation is going to be a large part of this project, which should allow the data tracking and pipeline features in DVC to shine. I can also run multiple sets of hyper parameters on my model to see how DVC shows experiment results.
Generating a workflow
When reviewing a project from a colleague or returning to work completed some time ago, my first task is to get the 30,000 ft view of what’s going on. DVC provides a DAG (directed acyclic graph) tool to create a helpful diagram. Here is the diagram for my analysis (both direct from the terminal, and processed in markdown). This helps my colleagues follow the code to ensure they understand what the tool is supposed to do when they are reviewing work. Using the diagram, I can also ensure the program is working as intended and dependencies are listed properly.
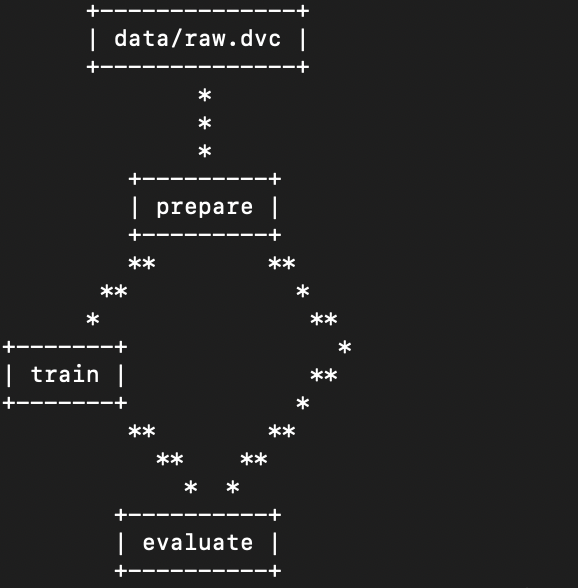
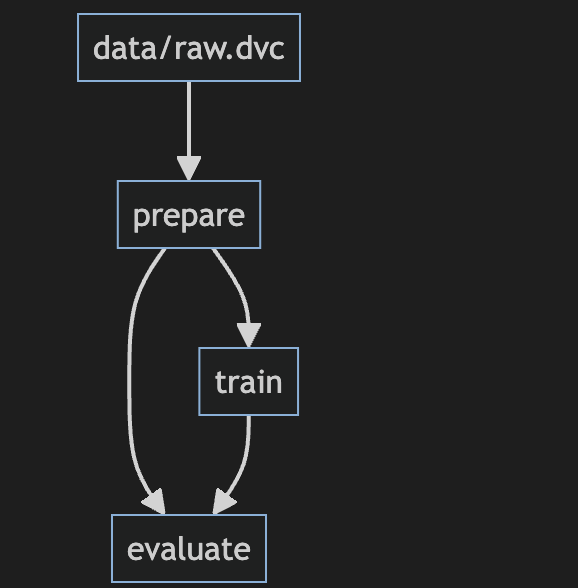
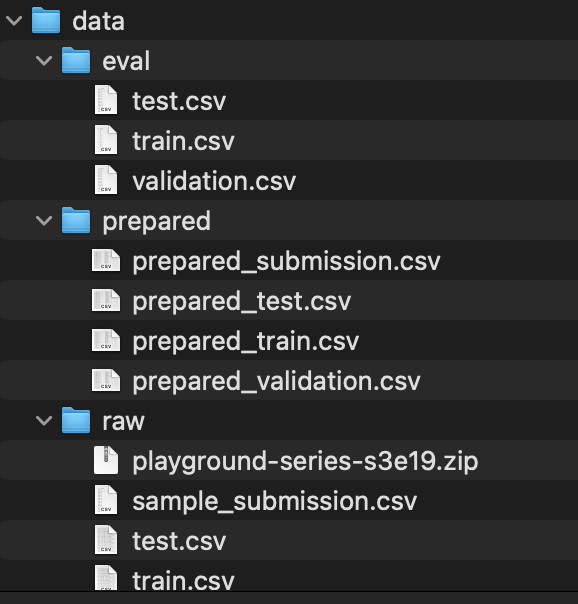
Each step of this process is defined in python files and linked together via a yaml configuration. When experiments are run, each step is processed as needed depending on which of its input dependencies have changed. In the example above, any changes to the raw input data will trigger the prepare script to execute. The train script will run if there are any changes to the outputs from prepare, or if the train script itself has been edited. Each step can generate resources to be evaluated manually later, or to be part of the processing for later steps. This image shows the raw input files and data files generated dynamically by the prepare and evaluate steps.
Evaluating results (with plots!)
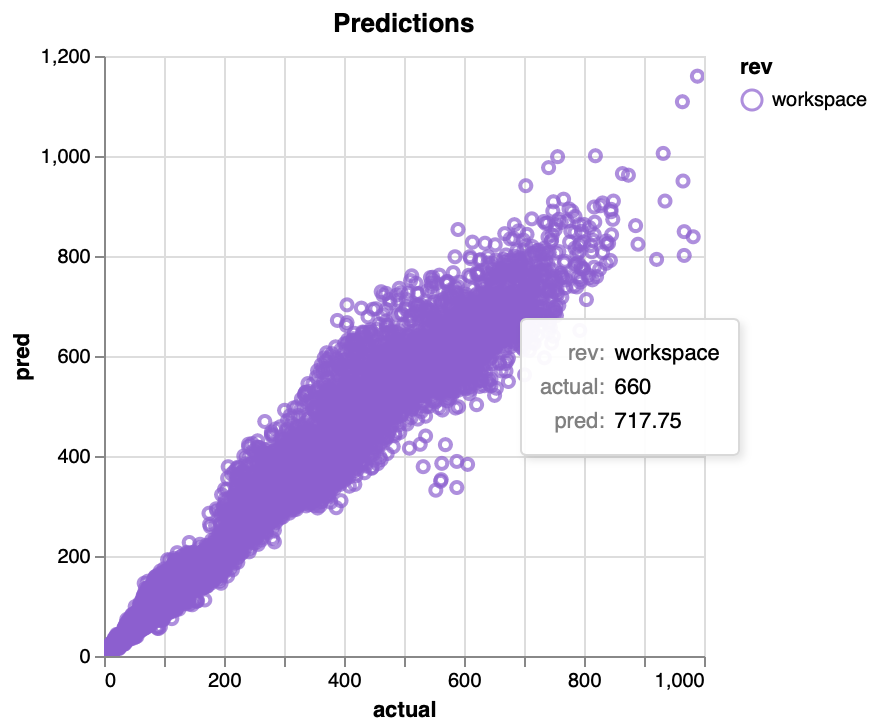
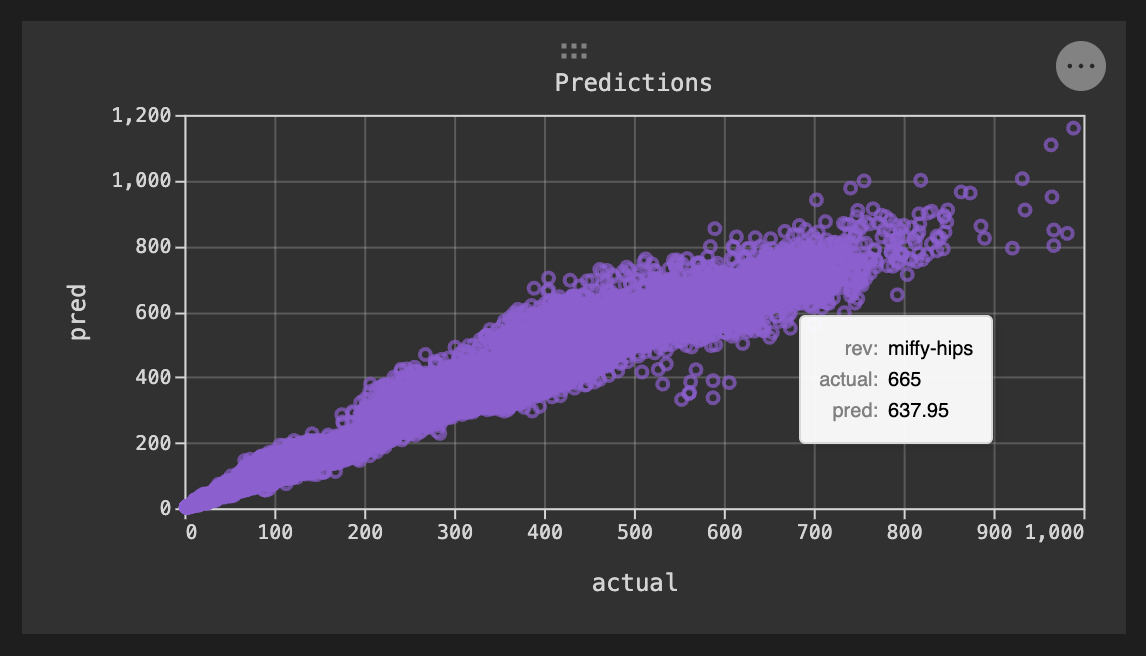
An unexpected surprise is how adeptly DVC handles plots. Myevaluate step typically produces a set of plots. DVC allows images to be created in your python script (first image row), or defined as interactive Vega-Lite plots to be generated by DVC. The plots can be shown as individual images, or in a local html file if a dynamic plot was requested (second image). DVC provides a plugin for VS Code that can generate dynamic views with static plot images from multiple experiments side by side (and dynamic plots overlayed!). The dynamic plot as viewed in VS Code is in the third image below - note that the plugin has also shown the name of this experiment run name (miffy-hips) instead of just showing the current workspace iteration of the plot.
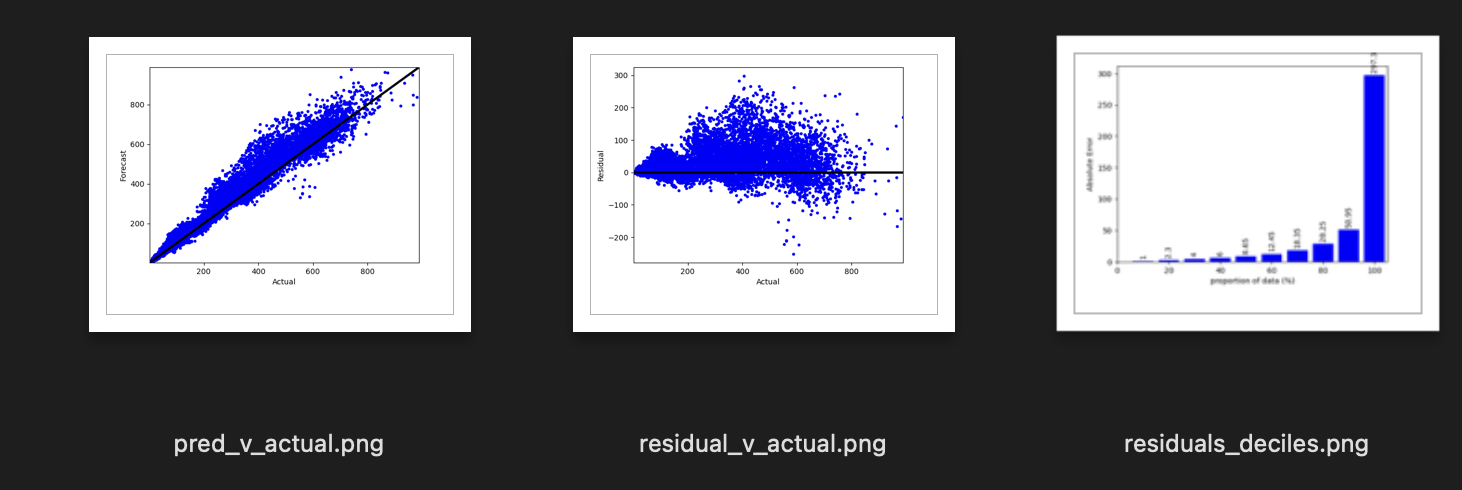
 .
. 
Experiment tracking
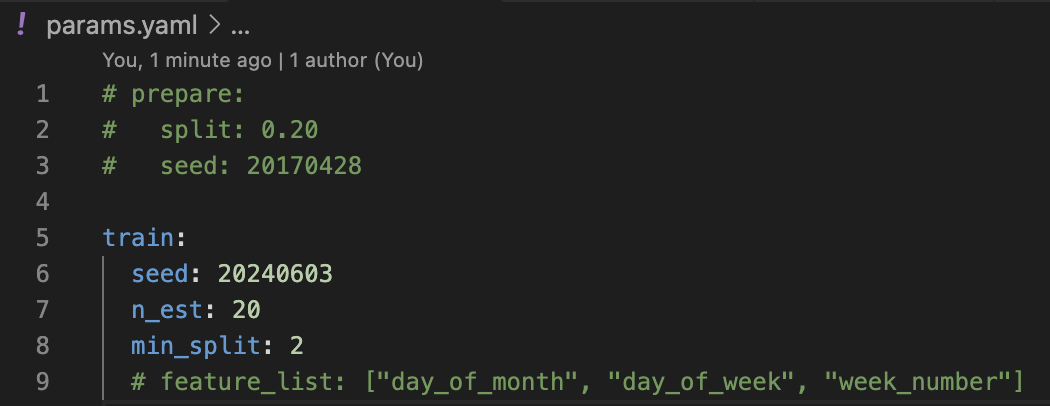
As indicated above, I have made frequent use of the parameter and experiment tracking provided by DVC for this project. Once the pipeline is running for a single parameter set using the DVC configuration files it is trivial to start a grid search over those parameters without modifying any of the underlying Python code. My random forest model is set up to take three parameters in the training stage: a random seed, number of estimators in the forest, and the minimum number of rows required to split a leaf node in each tree. DVC allows passing parameters to any stage of the pipeline, and while the competition’s time series formulation requiring a full year prediction does not lend itself well to random splits in the preparation stage, one could add parameters there (as seen in the commented section of the figure below) or in any other stage as needed.
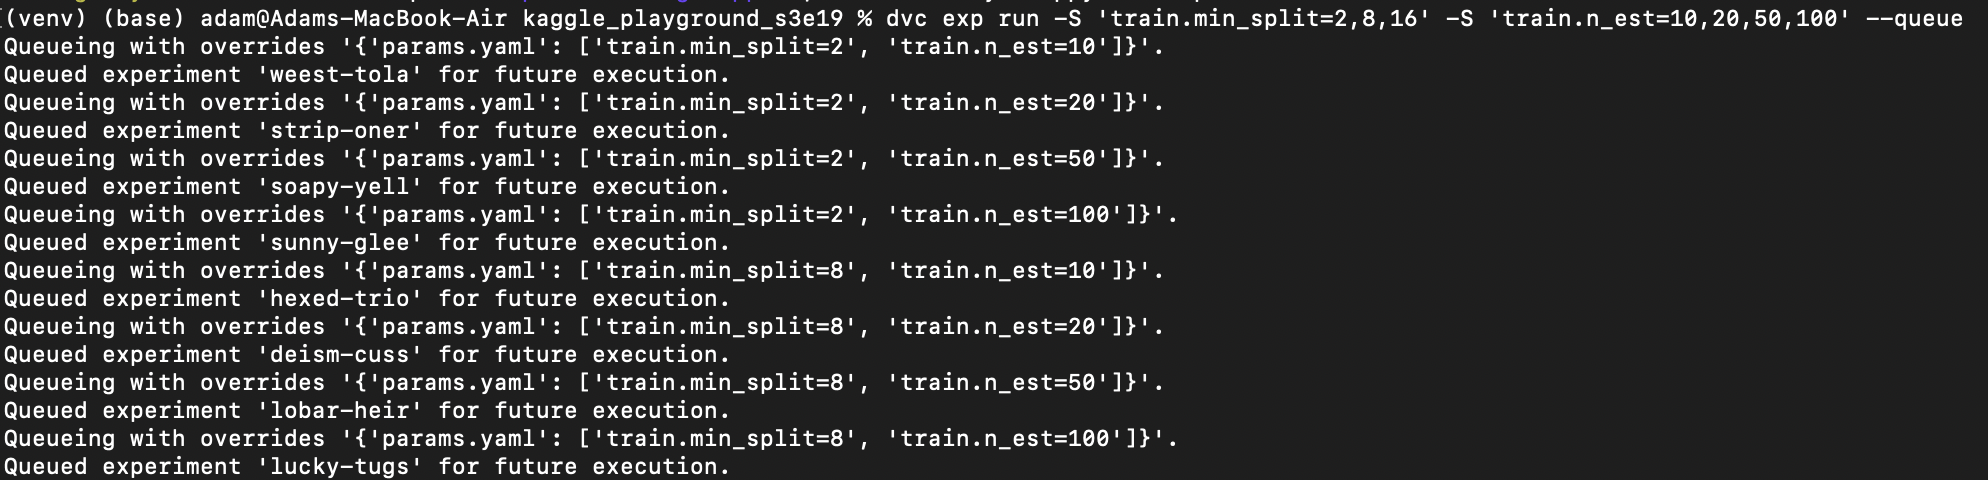
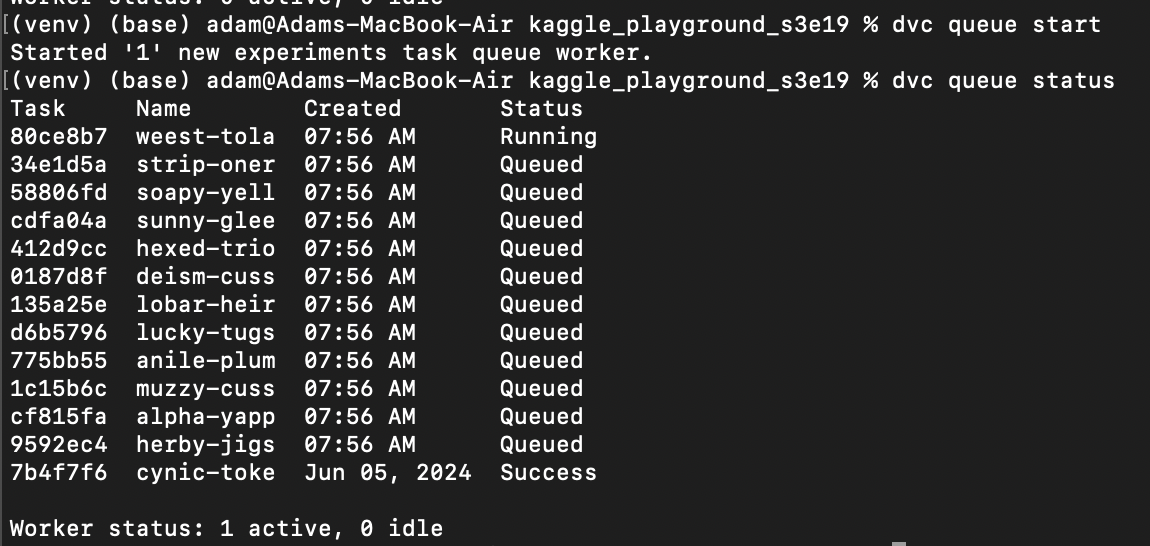
You create experiments in the DVC command line interface to run a grid search as shown below. Note that each iteration of the run is given a name to make referring to the models easier on plots and tables. The queuing system in DVC will process tasks in the background and provides tools for following the status of each experiment. Results will be tabulated and can be explored via the command line, or with the help of IDE plugins.
VS Code integrations
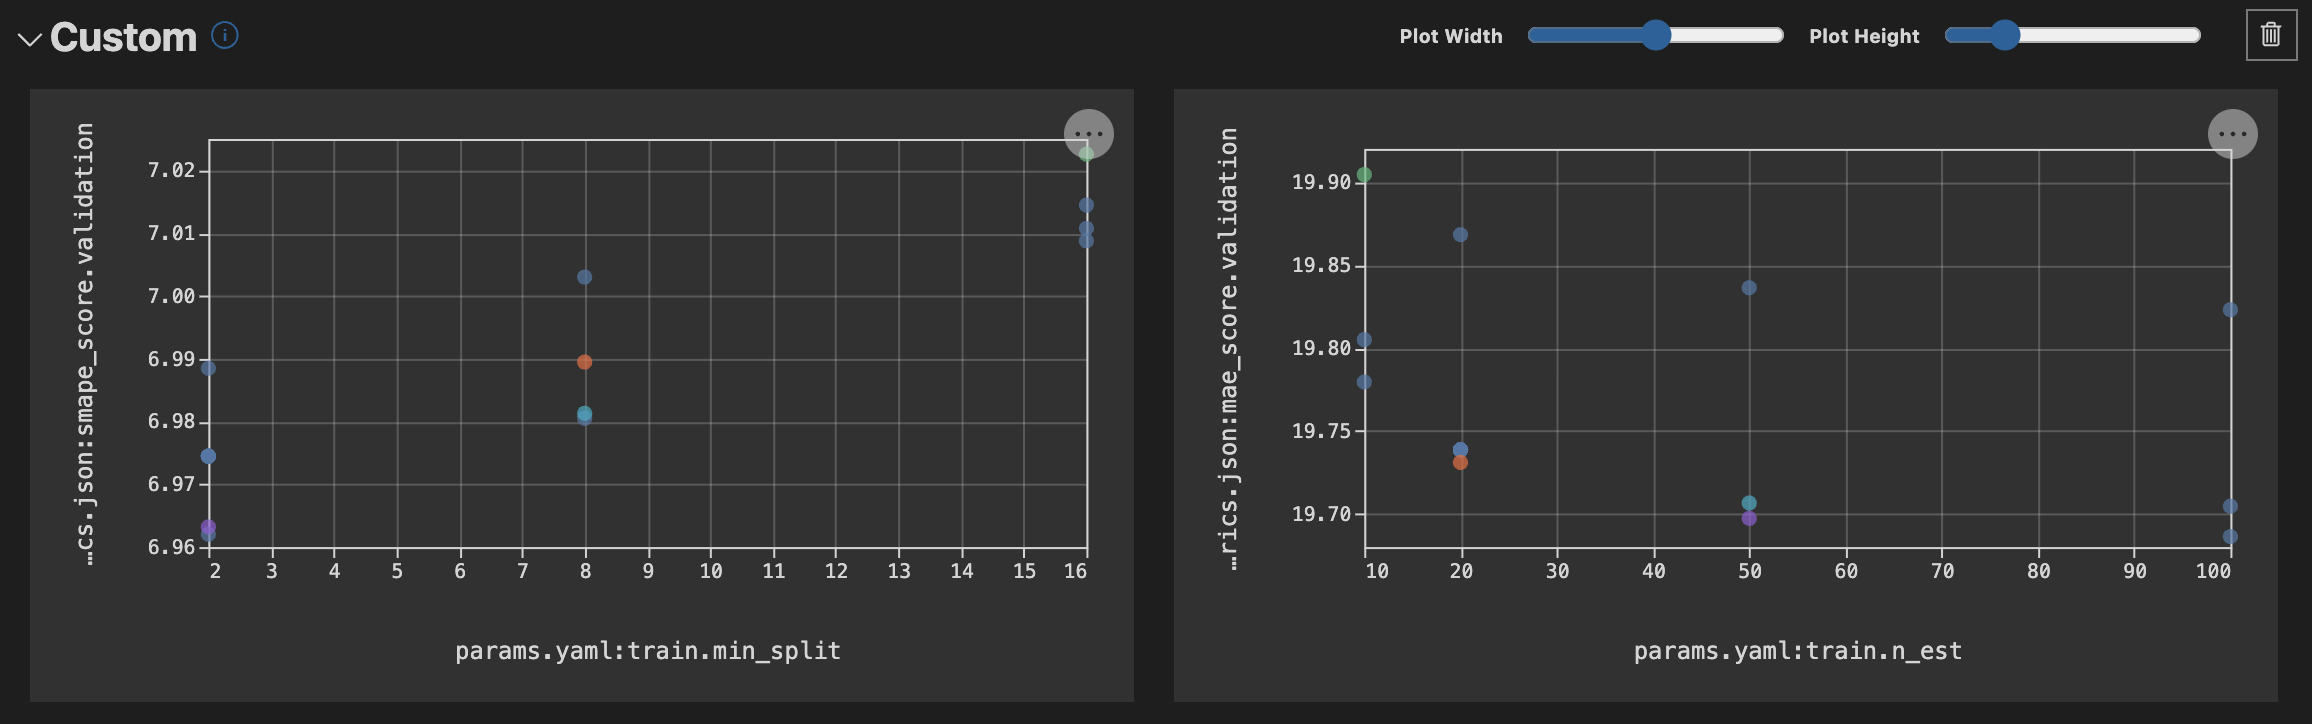
The VS Code plugin provides a workspace to explore your experiment runs. This image shows the metric scores from each experiment (i.e. each unique set of model parameters). There are filtering options for determining which revisions to show, and also for limiting the columns shown. In this case I am hiding the feature_list column which was used early in the project but is no longer active. Another feature of the DVC VS Code plugin I am enjoying is plotting the change in metric values across the parameter space with custom plots as seen in the image below the table.
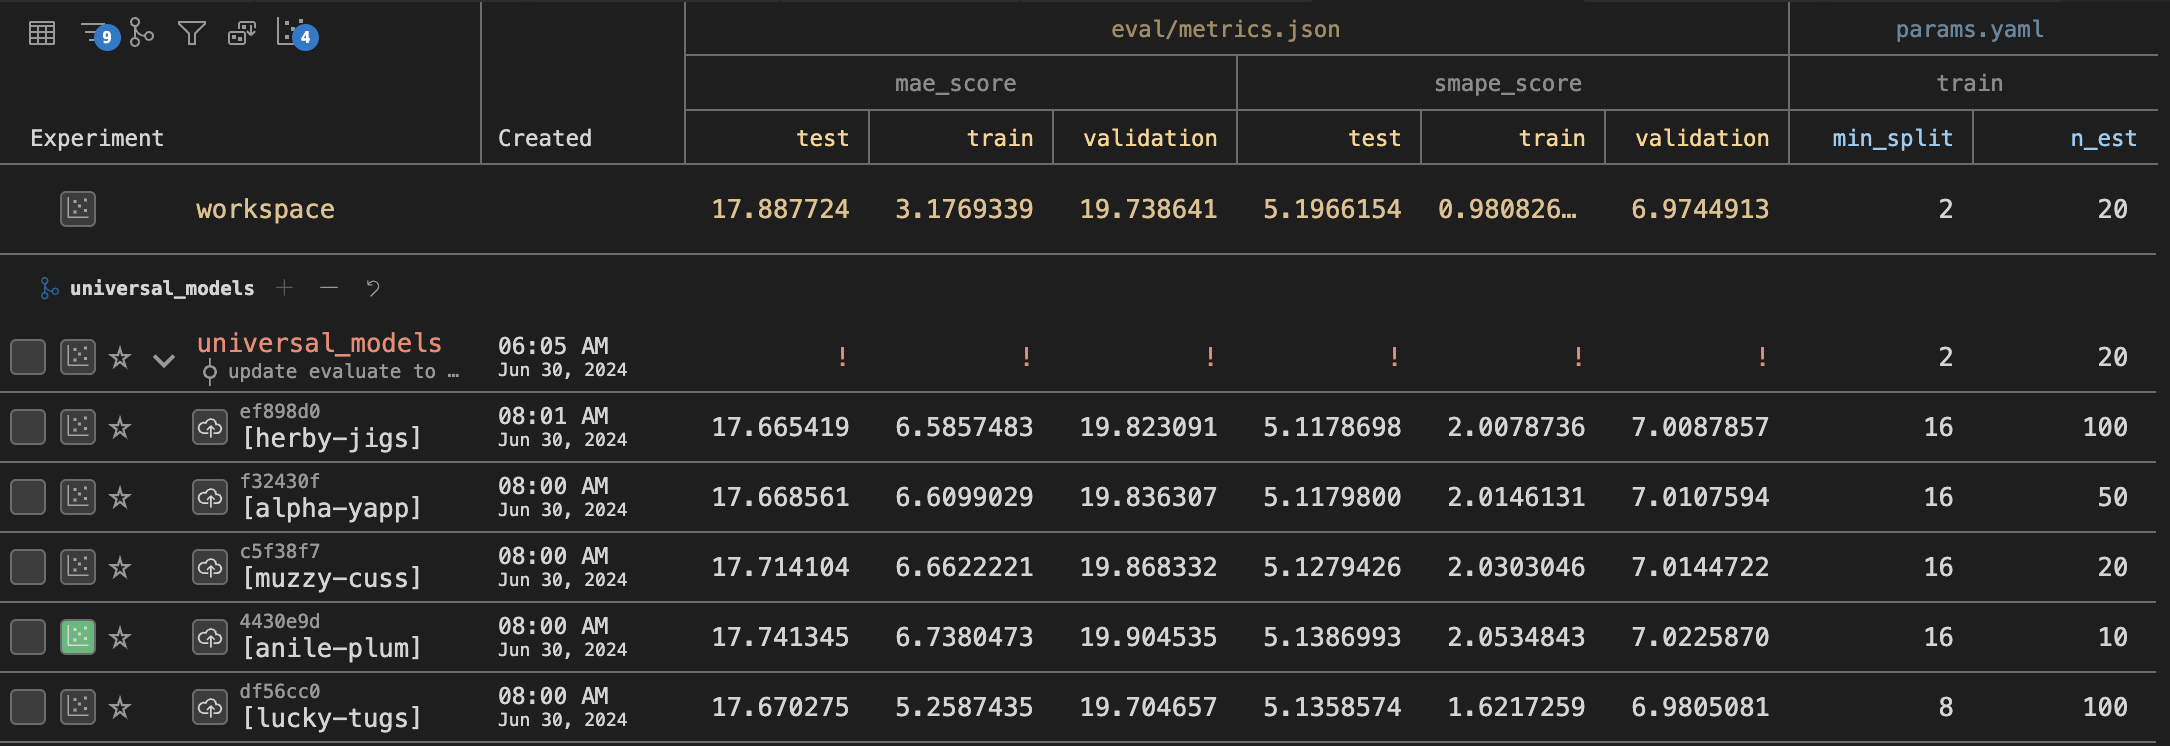
You might also notice in the image the row in bold red text. This is a git commit item showing which git branch the experiments belong to. DVC works in concert with git to provide a traceable history of the project without littering git logs with excessive entries for each hyper parameter experiment. This does mean that git elements can play a role in the organizational structure of DVC projects. I plan to organize my work by running different models in separate branches, using tags to highlight the best version of each model type, and potentially creating an ensemble model from that collection.
Conclusions
I’ve been impressed with DVC while working through this project. There is a bit of a steep learning curve to get everything setup just so - particularly when considering the customization options for interactive evaluation plots in the VS Code plugin. I don’t think I can expect each member of my team to learn how to set one up from scratch. Tweaking a template, however, seems very simple and something that would scale well across my team. Enforcing an end to end project mindset, as DVC does, reduces the prevalence of ad-hoc notebooks and lost work due to making code fit to execute again. DVC leaves room for ad hoc analysis along side the official workflow, but much of its power comes from establishing a repeatable workflow. One point of the workflow I hadn’t considered before starting is which items extra care in naming will promote increased readability. Steps in the YAML config files will show directly in output DAG images, which can automatically document the pipeline with some care.
I’m looking forward to testing a couple more features (git branch integration and collaboration on remote data sources) before suggesting this tool to my team.